

smart home storage monitoring
neocontrol
- Length6.340 pixels
- Reading Time4 min 15 sec
- Create
Engineer
Advise80%
90%
40%
- show your data
- Green Transparency - Hightech goes Ecology
- Coverage Coloring
- Cheat Sheet
- Gaming and Goodies
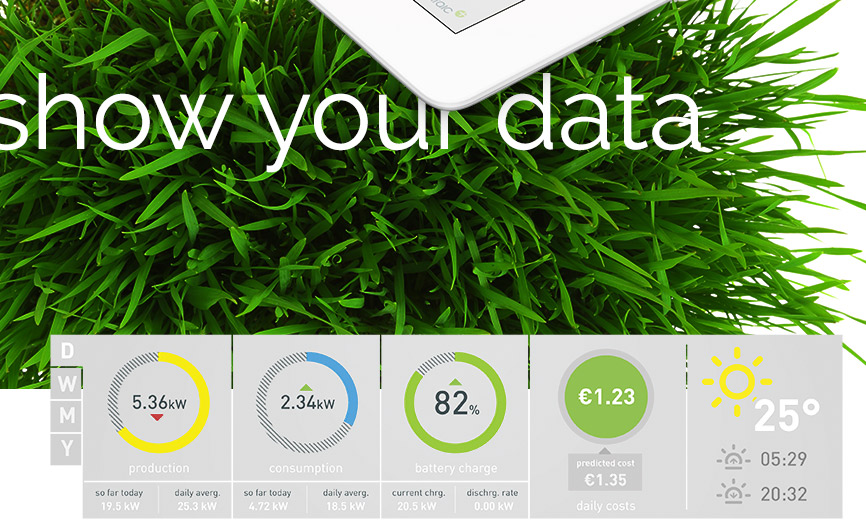
show your data
Data visualization no longer only serves for presenting figures that indicate the level of certain factors. Data is aggregated, processed and used - and forms increasingly complex information on aspects that go beyond measured data and create meaning. Behavior as well as risks from it – in the right context is data constitutes an image and voice of an individual lifestyle.
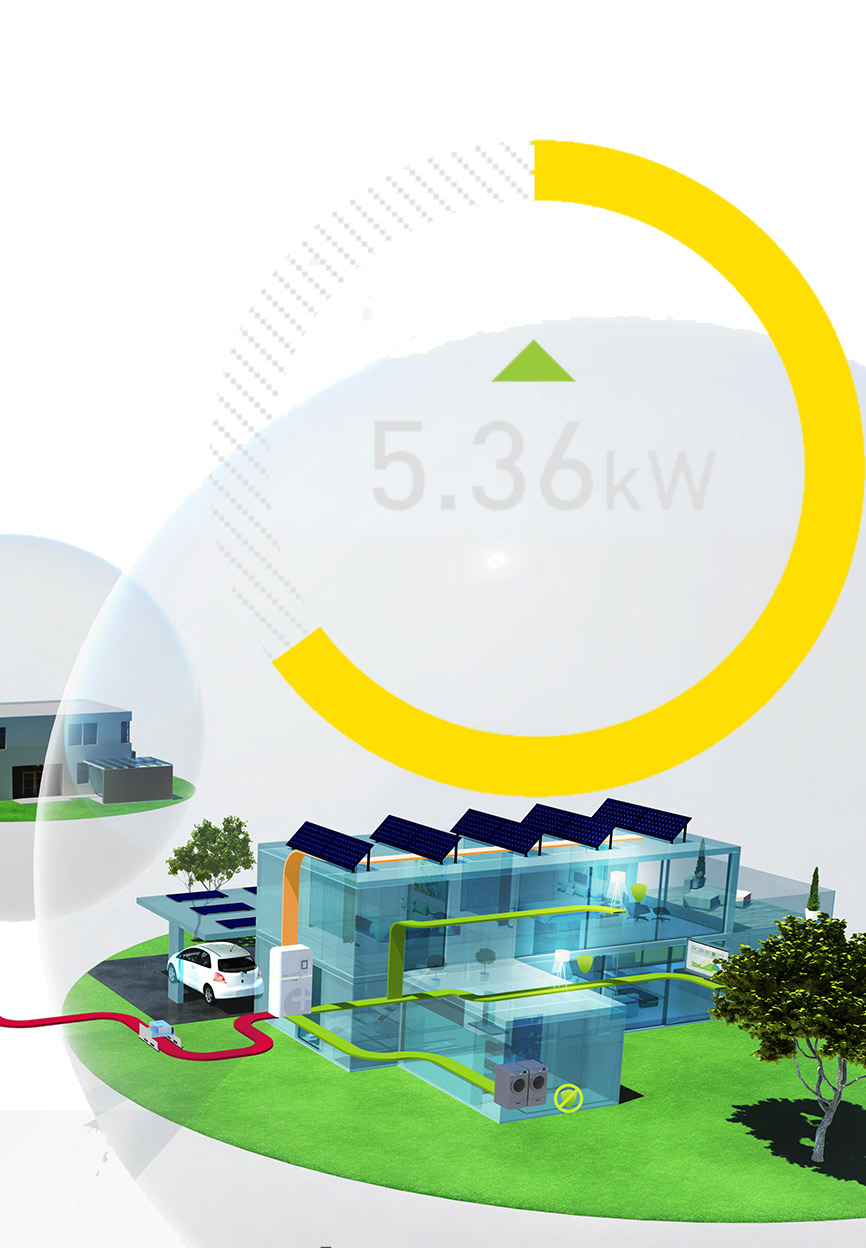
Green Transparency - Hightech goes Ecology
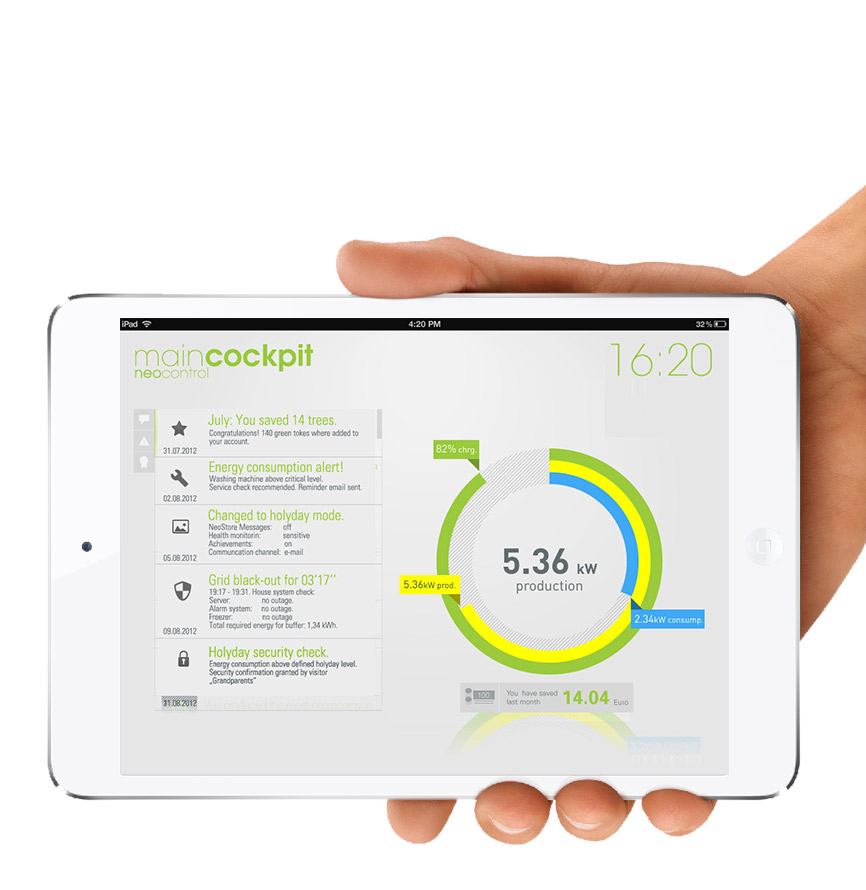
Green Transparency. NeoControl – the Cockpit-App for private energy storage power plant. Real-time visualization and evaluations, power consumption and savings – for solar systems with storage systems.
Expensive purchases are often ungrateful – especially when the main concern is the technical infrastructure of a house. They are considered to be very important, yet as soon as it is purchased they are often hardly noticed. This is where monitoring apps have the task and potential to illustrate the values and benefits for users continuously. Through this, decisions are made rationally come to a good gut feeling.
Data visualization no longer only serves for presenting figures that indicate the level of certain factors. Data is aggregated, processed and used - and forms increasingly complex information on aspects that go beyond measured data and create meaning. Behavior as well as risks from it – in the right context is data constitutes an image and voice of an individual lifestyle.
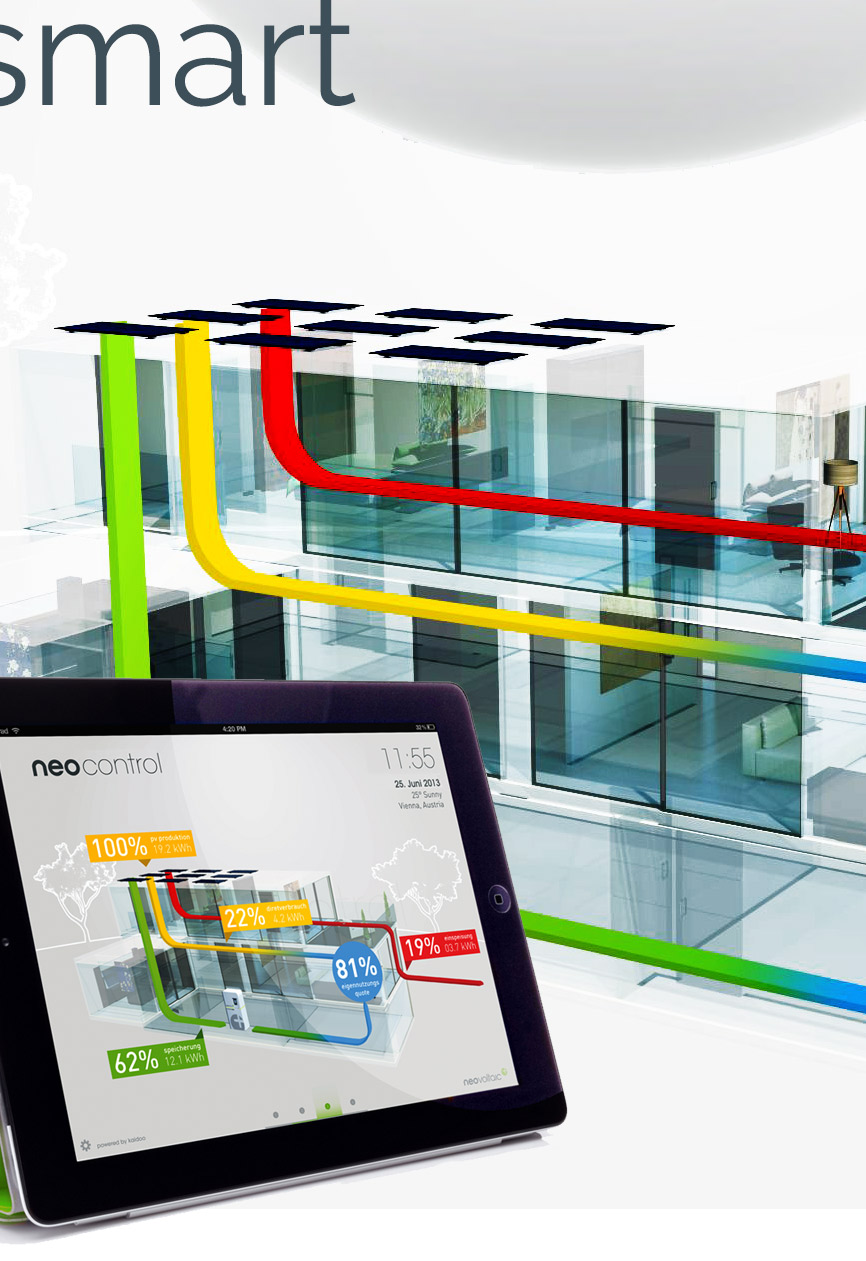
Coverage Coloring
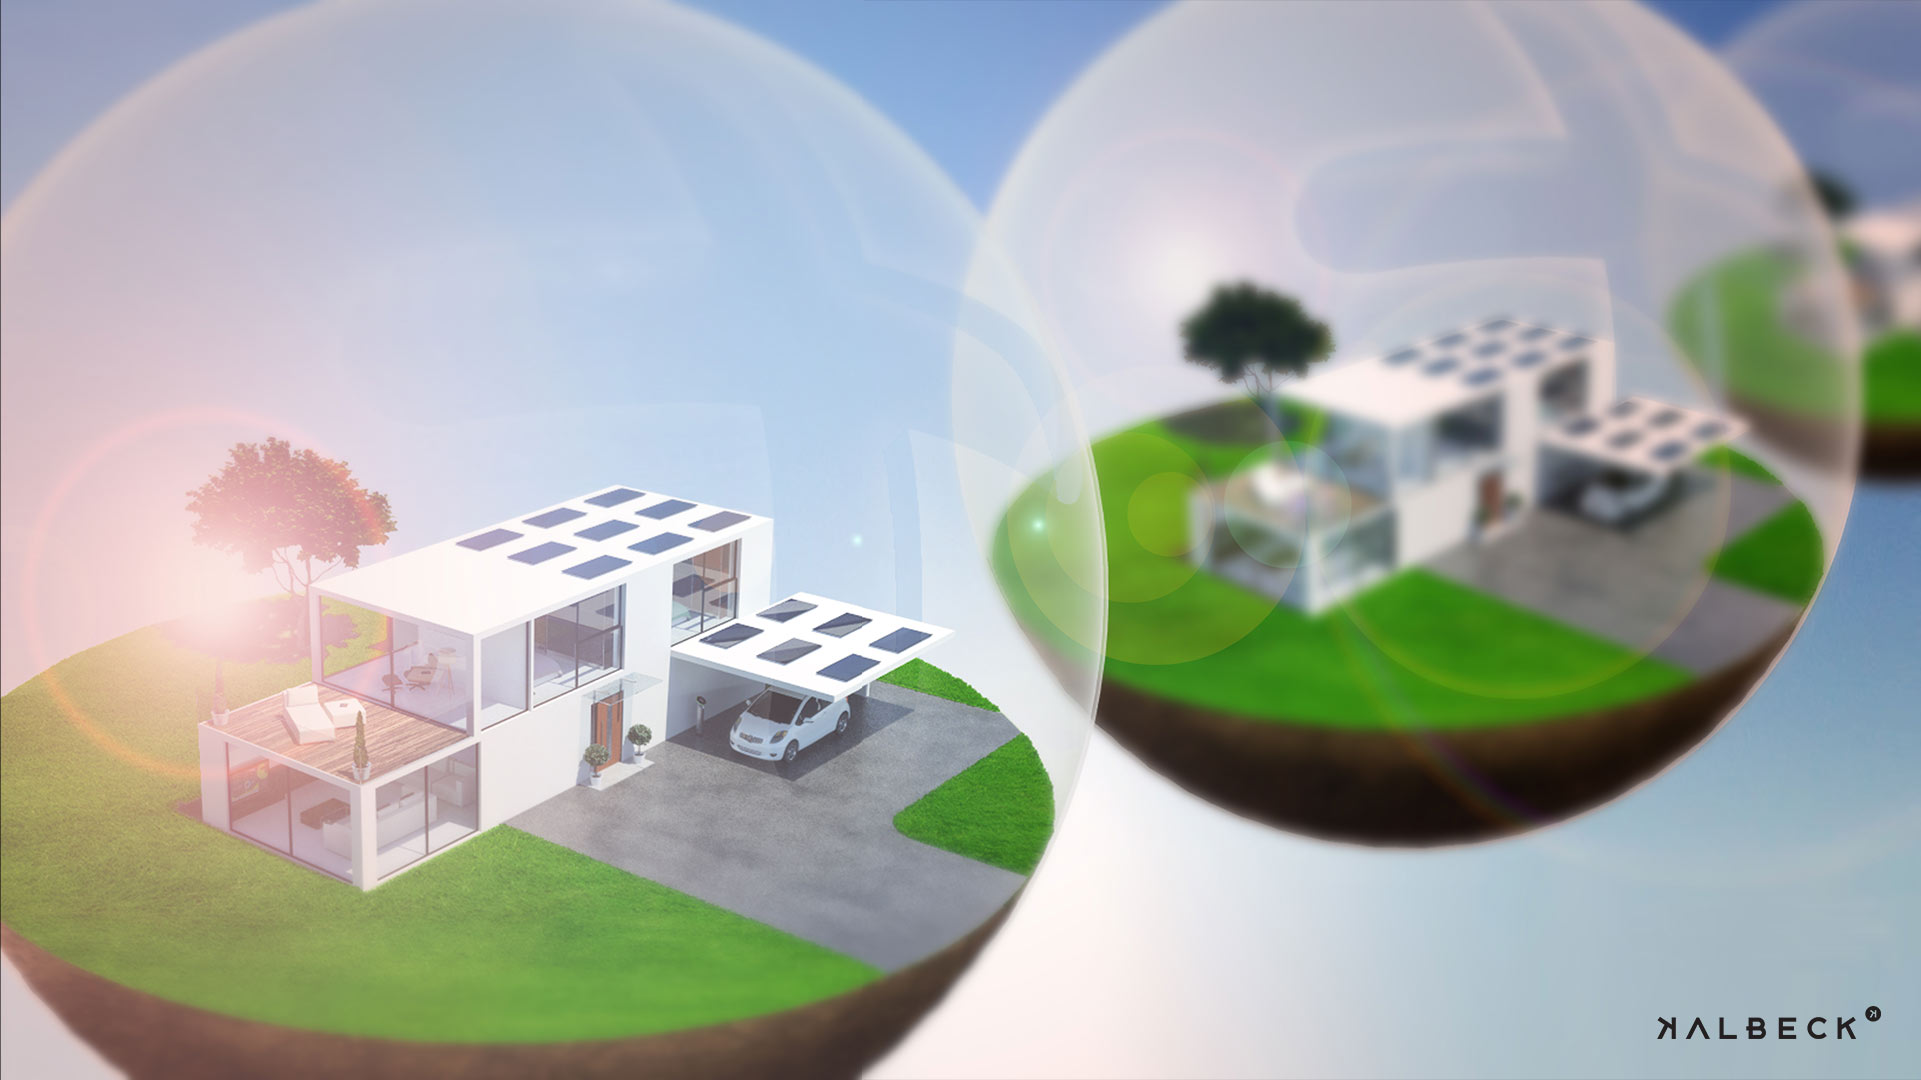
Consumption in Color. By using NeoControl, residents and users are able to directly read from an interactive 3D model of their house and see what is happening with the power generated by their own solar system - direct use, temporary storage or feed-in.
The chart shows how much the solar system with its included memory benefits a household each day. The 3D visualization of the house is abstract in order to be generally valid - the presented data, however, is all the more specific, concrete and coming directly from the system.
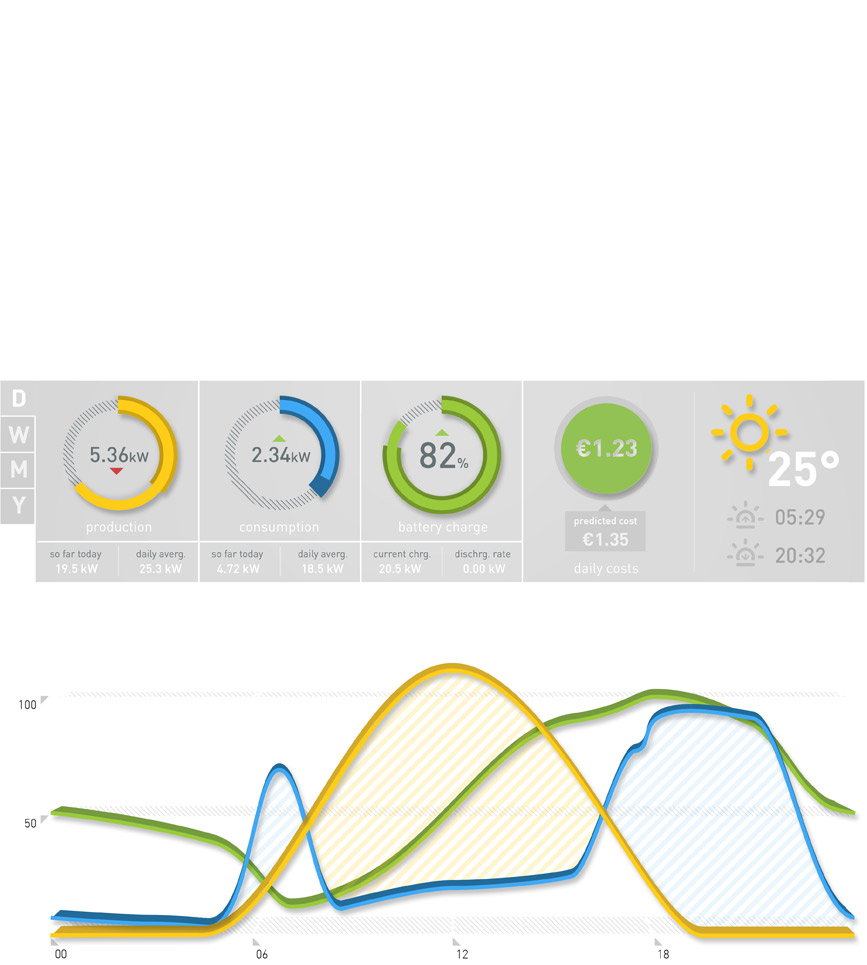
Cheat Sheet
Interactive Infographics. As paradoxical as it may sound, in order to improve the clarity and expressiveness, oftentimes you have to reduce the precision. In the case of NeoControl, this specifically means that data is not displayed in the level of detail that is possible on a technical level, but is displayed to the degree that it is most useful. Only in this way can trends in an individual consumption profile be detected.
Therefore, the data of the solar and storage system are processed in real time and any outliers are removed. The production as well as the consumption curves are smoothed automatically (where it makes sense).
The attention is focused away from significant events such as consumption peaks (heat pumps) or short production break-ins (clouds) and is steered towards the compatibility and recognition of trends in order to understand power as a resource and use it more efficiently.
Gaming and Goodies
Gaming and Goodies. A playful ecological translation makes the abstract data far more comprehensible: out of saved kilowatt-hours come juicy green leaves, trees, and entire forests.
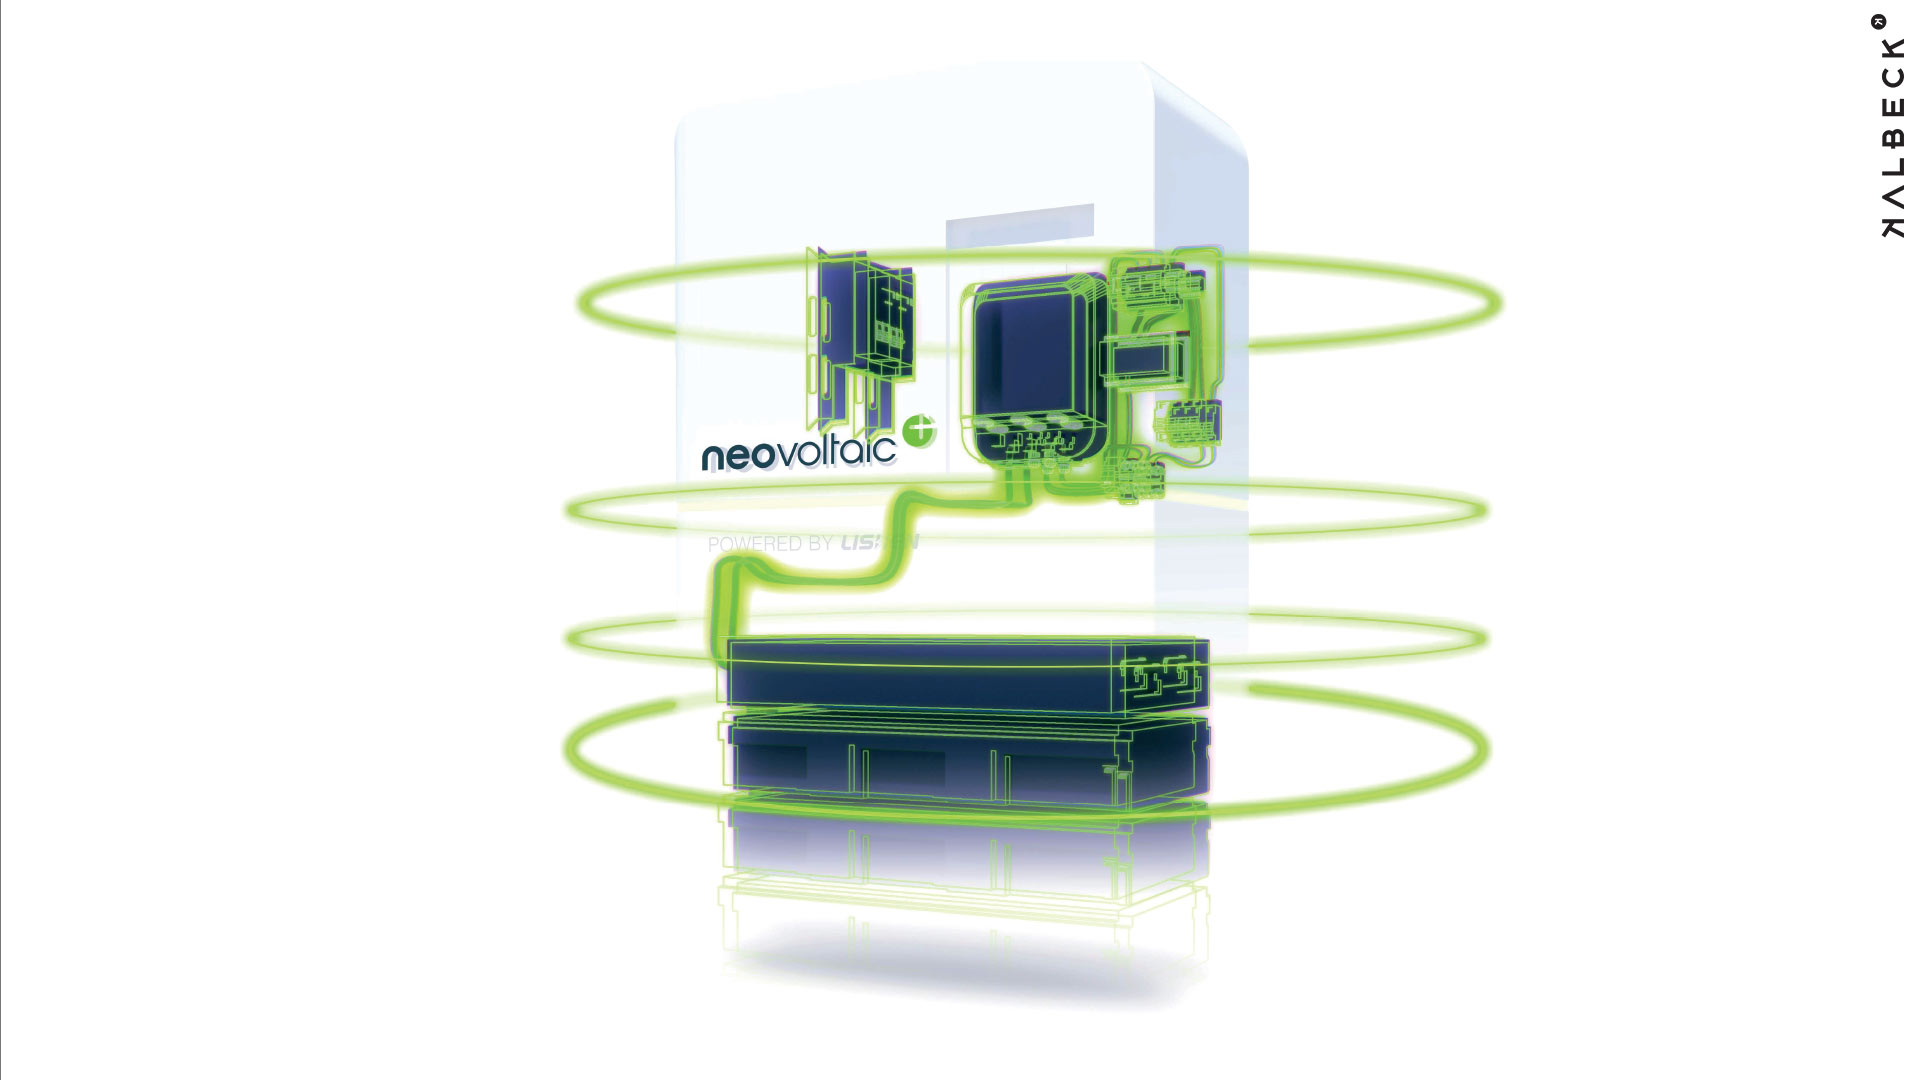
The app is delivered with each energy storage installation. The data is aggregated in real time via a separate cloud, then edited and published as a tablet or web app. By providing demo accounts, the app additionally becomes a relevant pillar of the sales process, which makes the energy turnaround a private experience.
Weiterführende Artikel
Next Generation of Photovoltaic
neovoltaic AG
From the vision to the stock company in just 18 months - the development of the brand "neovoltaic" shows the massive speed of the startup industry - and how to make the best out of it.
[ startup development | branding | online | print ]

Facts vs. Understanding
Areas of conflict in technology communication
Comprehensible, geared to the target group, and user-orientated is what technology has to present itself with to be able to compete in the fight for attention. The following examples show possible ways how this is done.
Vertical Engineering
neovoltaic AG
From the control of power electronics using client/server interfacing to the server environment and the monitoring apps: vertical engineering at work..
[ technology | advise | software engineering | backend | frontend | app | UX | online ]

The KAIDOO product series
Digital precision tools
Highly specific functionality, optimal symbiosis, and developmental efficiency allow kaidoo:screen, kaidoo:things, kaidoo:CMS, and kaidoo:data to be transformed into tailored and up scale technology tools in the area of digital manufacturing. kaidoo:slides and kaidoo:mag complement the product series as the valuable solutions.